How to test K+ content in soil with Flame photometer
Jul 21, 2025
How to test K+ content in soil with Flame photometer

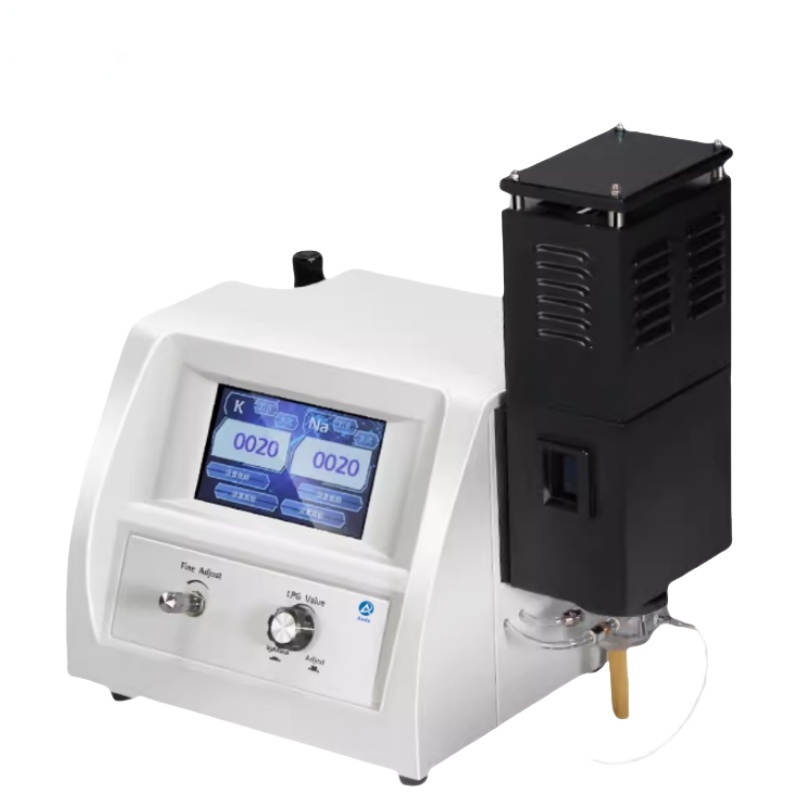
The soil available potassium content is an indicator that directly reflects the soil's ability to provide potassium. Especially for seasonal crops, there is often a good correlation between available potassium and the amount of potassium absorbed by crops. This scheme refers to the standard NY/T 889-2004 "Determination of soil available potassium and slow-release potassium content" and uses the Instrument and Electrical Analysis FP64 series flame photometer to determine the soil available potassium content, which is simple, fast and easy to operate.

When neutral ammonium acetate solution is used as the leaching agent, NH4+ exchanges with K+ on the surface of soil colloids and enters the solution together with water-soluble potassium. The potassium in the leaching solution can be directly measured by a flame photometer. The measurement principle is that the sample is sprayed into the flame by an atomizer to stimulate luminescence. After spectroscopy, the emission intensity is measured by the detector. The emission intensity is proportional to the potassium content in the sample soil.
Operation
1. Draw the standard curve
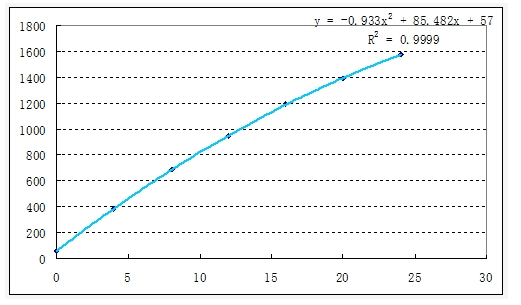
Pipette the potassium standard solution (0, 2.00, 4.00, 6.00, 8.00, 10.00, 12.00) mL with C (k) = 100 μg/mL into a 50 mL volumetric flask, and dilute with ammonium acetate solution to obtain a series of potassium standard solutions with solubility (0, 4, 8, 12, 16, 20, 24) μg/mL. Use the blank solution to adjust the instrument zero point, measure on a flame photometer, draw the standard curve and find the regression equation.
2. Sample processing
Weigh 5.00 g of the air-dried sample that has passed through a 2 mm aperture sieve into a 200 mL plastic bottle, add 50 mL of neutral ammonium acetate solution (soil-liquid ratio is 1:10), cover the bottle cap, shake well, oscillate at 20-25 degrees for 30 minutes, and dry filter. The filtrate is directly measured on the flame photometer, and a blank solution is made at the same time.
3. Sample analysis results, draw the curve

CONTACT NOW


